
Neuro-structural Changes in Dementia
Research Question
Which specific brain regions exhibit statistically significant voxel-level differences between normal aging (“age”) and demented status (“CDR”: Clinical Dementia Rating) as measured by MRI scans?
We’ll answer the question by essentially performing a linear regression on each voxel in the brain scan (general multivariate regression model), thresholded (using the Benjamini-Hochberg procedure) on the analog of a p-value 5%, and showing, with an intensity, how each voxel influences either dependent variable (age or CDR score).
We hypothesize that Alzheimer’s and dementia will show distinct, highly correlated patterns of degeneration in the temporal, frontal and parietal lobes, while aging will show more general brain atrophy such as increased intracranial space and more area present in the ventricles.
Alzheimer’s and dementia are categorized by plaque buildup, inflammation, and neuron death starting in specific brain regions while chronological age is commonly associated with a reduction in white/gray matter volume overall.
Dataset Overview
OASIS-1, is a public dataset available from the Open Access Series of Imaging Studies (OASIS) project at Washington University in St. Louis. The dataset consists of two main parts: demographic data and MRI imaging. The limited demographic data (10 variables) includes age, socioeconomic status, mental acuity and clinical dementia rating. The 403 MRI scans (13 outliers removed by Nilearn) are all T1-weighted.
Young and middle-aged subjects were from the Washington University community while older subjects, regardless of demented status, were from the Washington University Alzheimer Disease Research Center (ADRC). All data used was obtained by trained technicians or clinical assessment1.
OASIS-1 Demographic Data
The demographic data consists of rows of information about each subject, cross-referenced with the MRI imaging using a unique subject ID. From the datasets associated paper, here is summary of the variables:
| Description | Column | Reference | Notes |
|---|---|---|---|
| Age at time of image acquisition (years) | age | ||
| Sex (male or female) | mf | ||
| Handedness (not listed in descriptions) | hand | all right-handed for consistent brain imaging | |
| Years of education | educ | ||
| Socioeconomic status | ses | Hollingshead, 1957 | |
| MMSE score (ranges from 0 to 30) | mmse | Folstein, Folstein, & McHugh, 1975 | |
| CDR scale (0 to 2 indicating AD severity) | cdr | Morris, 1993 | |
| Atlas scaling factor | asf | Buckner et al., 2004 | |
| Estimated total intracranial volume (cm³) | etiv | Buckner et al., 2004 | |
| Normalized Whole Brain Volume (percent) | nwbv | Fotenos et al., 2005 | |
| Image acquisition delay (not listed) | delay | ||
| Unique participant identifier | id |
The left hemisphere and the right hemisphere play different roles in our brain. The left hemisphere controls the right side of the body, whereas the right hemisphere controls the left side of the body.2 For our dataset, it is important to note that all participants were right handed to account for brain lateralization. Having all right handed individuals is crucial because right handed people tend to have a more predictable pattern for functions in the left hemisphere, while left handed people have a more variable pattern for functions in the right hemisphere. If the study included both left and right handed individuals, it could create more variability in the data. This adds an additional confound and makes it harder to focus on the differences between normal aging and demented status. What a researcher may think is a pattern for dementia could actually be a pattern for left handed people. By eliminating the potential brain patterns for left handed individuals, researchers can ensure that any patterns found are related to dementia and not anything else.
For our brain-structure association analysis, we will be utilizing chronological age (age), clinical dementia rating (CDR), and mini-mental state examination (MMSE) score.
Age is the age of the subject at the time of the first scan in years and is stored in decimal format.
Clinical dementia rating (CDR) is broken down in an accompanying “Cross-sectional Fact Sheet” attached to the original paper:
| CDR Score | Description |
|---|---|
| 0 | Nondemented / Cognitively Normal |
| 0.5 | Very Mild Dementia |
| 1 | Mild Dementia |
| 2 | Moderate Dementia |
The mini-mental state examination (MMSE) score is a short evaluation for mental acuity. It tests recall, reasoning and awareness. The full test and procedure for administering is referenced here 3. It’s score out of 30, with 30 being the best score and 0 being the worst.
OASIS-1 MRI Data
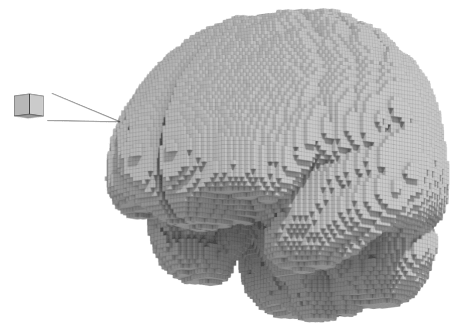
A single, still, MRI scan captures the state of the brain at a single point in time. (Also called a structual MRI (sMRI) or simply MRI. Each cube is called a “voxel” — a voxel is a three-dimensional counterpart to a pixel.
MRI machines have settings to produce either a more T1 or T2 weighted scan. The only difference is the TR (repetition time) and TE (echo time). Materials respond differently under specific electromagnetic pulses and we pick up these differences to produce the imaging data. Looking at the documentation, we see that OASIS-1 using T1-weighting. T1-weighting shows clear anatomy and fluids as dark and fatty tissue as light4. In T1, gray matter will be darker than white matter.
The OASIS-1 dataset provides a gray matter map and a white matter map. We need different maps because of how neurons are structured. Neurons have three primary sections: dendrites, a cell body or soma, and an axon5. Gray matter is mainly the central cell bodies where organelles like the nucleus and mitochondria are. White matter is made of axons which look different because of the myelin sheaths that support conductivity of electrical signals to the axon terminal.
One of our brain scan’s image size is 91 x 109 x 91 voxels which is equivalent to 182 x 218 x 182 mm. This encapsulated the typical brain size of 140 x 167 x 93 mm with a good amount of padding to spare.
From the nilearn library documentation, we know the following steps have already been performed:
In the DARTEL version, original Oasis data have been preprocessed with the following steps:
- Dimension swapping (technically required for subsequent steps)
- Brain Extraction
- Segmentation with SPM8
- Normalization using DARTEL algorithm
- Modulation
- Replacement of NaN values with 0 in gray/white matter density maps.
- Resampling to reduce shape and make it correspond to the shape of the non-DARTEL data (if fetched with dartel_version=False).
- Replacement of values < 1e-4 with zeros to reduce the file size.
1 Marcus, D. S., Wang, T. H., Parker, J., Csernansky, J. G., Morris, J. C., Buckner, R. L. (2007) Open Access Series of Imaging Studies (OASIS): Cross-sectional MRI Data in Young, Middle Aged, Nondemented, and Demented Older Adults. Journal of Cognitive Neuroscience. https://doi.org/10.1162/jocn.2007.19.9.1498
2 Ocklenburg, S. (2023, July 5). Left-handedness: What is right-hand bias?. Psychology Today. https://www.psychologytoday.com/us/blog/the-asymmetric-brain/202307/left-handedness-what-is-right-hand-bias#:~:text=Unfortunately%2C%20it%20is%20common%20practice,are%20different%20from%20right%2Dhanders.
3 Folstein, M. F., Folstein, S. E., McHugh, P. R. (1975) “Mini-mental state”: A practical method for grading the cognitive state of patients for the clinician. Journal of Psychiatric Research, Volume 12, Issue 3, Pages 189-198. https://doi.org/10.1016/0022-3956(75)90026-
4 Runge, V.M., Heverhagen, J.T. (2022). T1, T2, and Proton Density. In: The Physics of Clinical MR Taught Through Images. Springer, Cham. https://doi.org/10.1007/978-3-030-85413-3_31
5 Cleveland Clinic. (2023, March 19). Grey Matter. Cleveland Clinic. https://my.clevelandclinic.org/health/body/24831-grey-matter
Visualize MRI Data
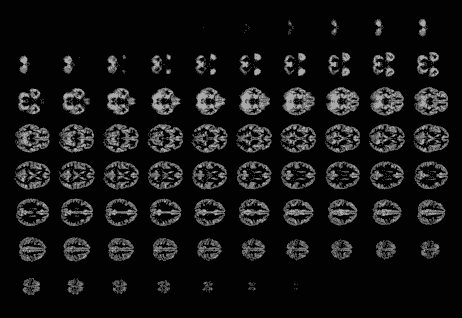
We can visualize a single transversal gray matter slice using Matplotlib:
Or as a montage of slices:
According to the Marcus et. al. paper, Nilearn separated the gray and white matter using this following method: Segmentation of brain MR images through a hidden Markov random field model and the expectation-maximization algorithm
You can also simply use a brain template – a template volume that corresponds to a section of the brain.
We mask/threshold the scans using a gray or white matter mask to obtain clean slices without holes:

Basic Voxel-Based Morphometry (VBM) Procedure
We fit a linear model per voxel, like:
For subject \( i = 1, \cdots, N\) and voxel \( v \)$$\text{intensity of voxel}_{iv} = \beta_{0v} + \beta_{1v}\cdot \text{Age}_i + \beta_{2v}\cdot \text{Sex}_i + \beta_{3v}\cdot \text{CDR}_i + \epsilon_{iv}$$
Where \( \beta_{0v} \) is the intercept term, \( \beta_{1v} \) is the effect of aging on voxel \( v \), \( \beta_{2v} \) is the effect due to Sex, \( \beta_{3v} \) is the effect of CDR (clinical dementia rating) and epsilon is residual noise.
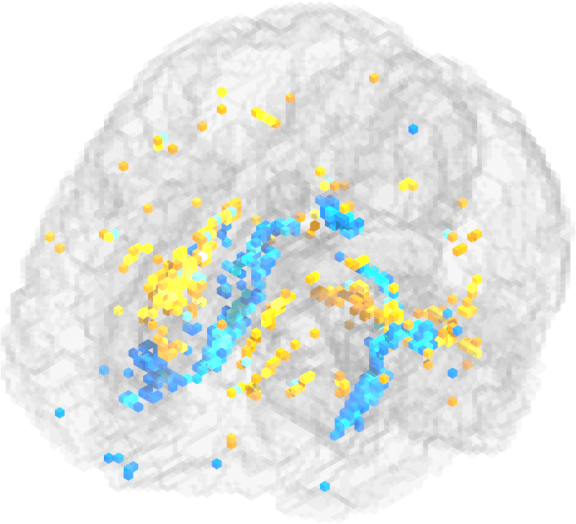
We fit this to each voxel individually and re-structure the results in the same format to visualize like:
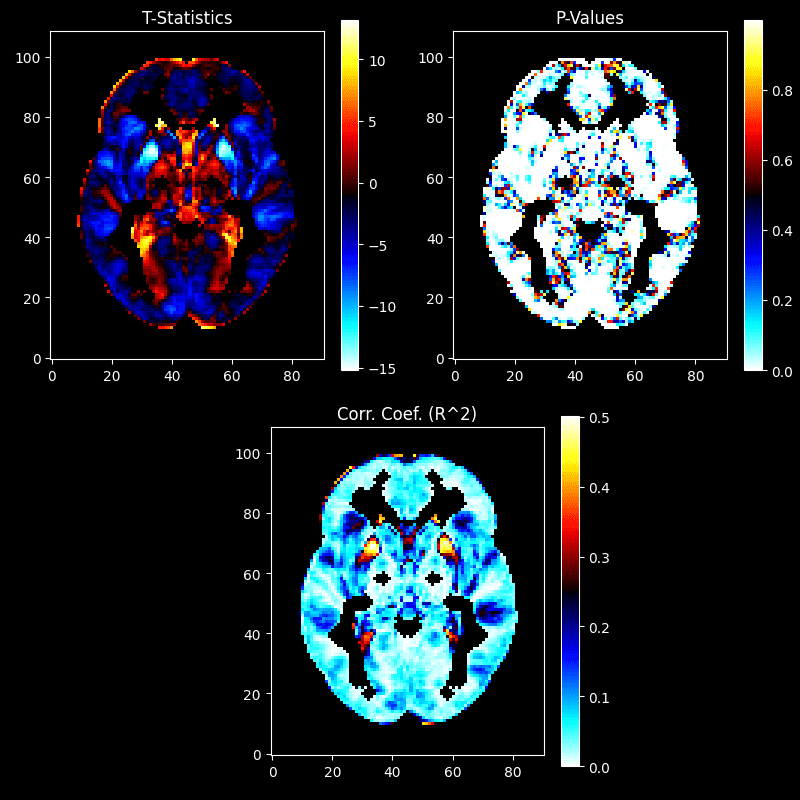
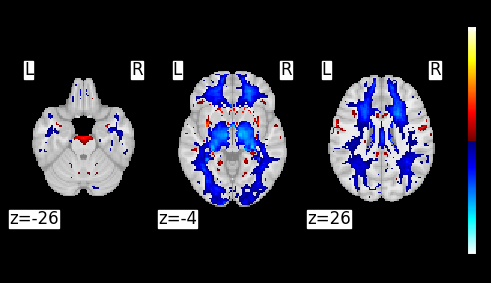
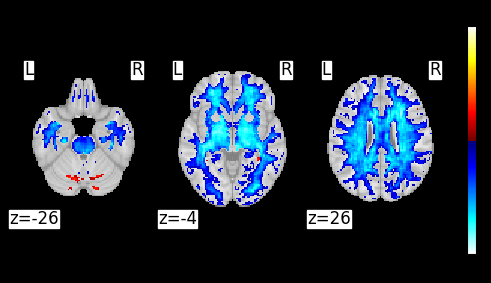
If we mask the t-statistics by p-value and use the Benjamin-Hochberg correction so that our false discovery rate is 5%, we’re left with:
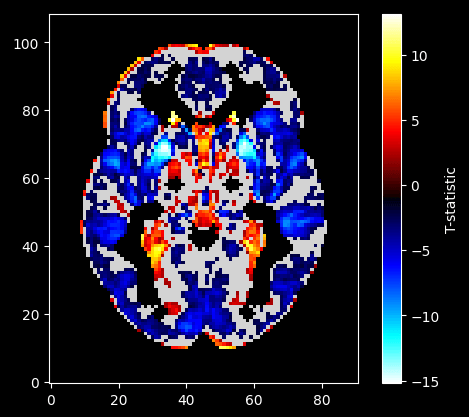
age (with the effect of clinical dementia rating (cdr) and sex (mf) removed).Explanation:
We displayed the plot with all but the gray matter masked as well as non-significant voxels masked.
- We took all 403 subjects’ brain imagery.
- We fitted an OLS model to each voxel and provided it a design matrix containing our IV, in this case:
age, and confounds:cdrandsex. - We saved the OLS output to arrays of the same shape to visualize the process.
- We took the p-value array and did a multiple comparisons test on to make our “new p-value” (FDR) threshold more stringent.
- We masked the t-statistic array by only the significant p-values from the p-value array.
- We displayed the plot with all but the gray matter masked as well as non-significant voxels masked.
Implicated Brain Regions
To answer our original question regarding differences in brain structures associated with aging versus demented status, we need to know what brain structures are implicated. We’ll generate the t-stat brain shapes and analyze the slices visually as well as statistically using a brain atlas/pre-generated labels. Then, we’ll look at which labels have a high mean t-stat score and go through the list to verify.
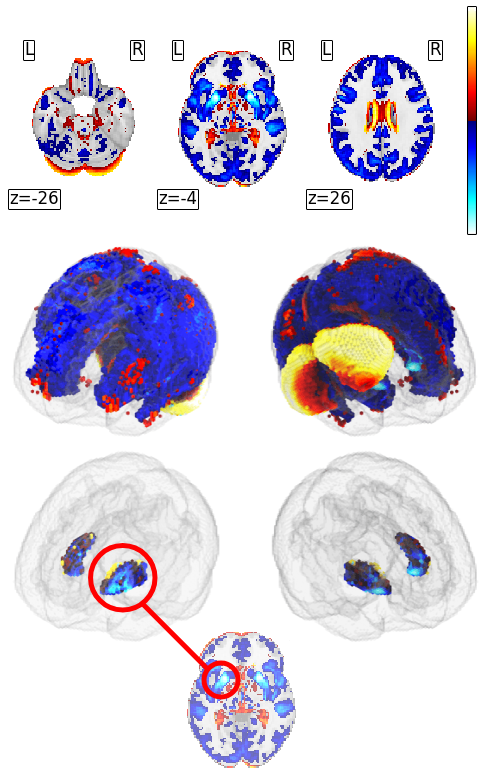
Slices of the Z-map (top), 3D view of the Z-map (middle), and only the putamen masked (bottom).
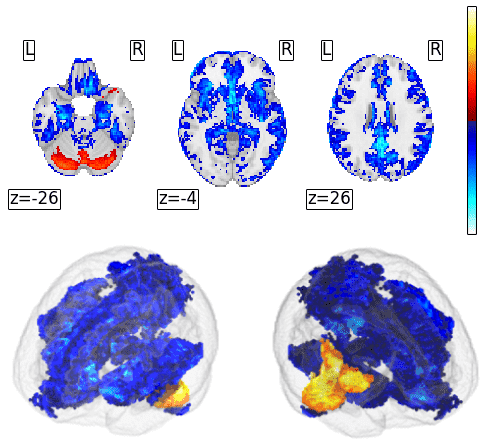
Slices of the Z-map (top), 3D view of the Z-map (bottom).
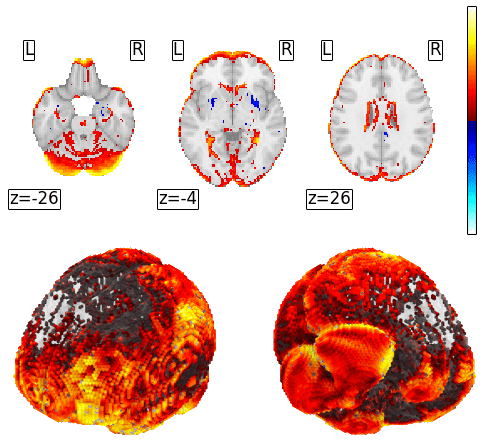
Slices of the Z-map (top), 3D view of the Z-map (bottom).
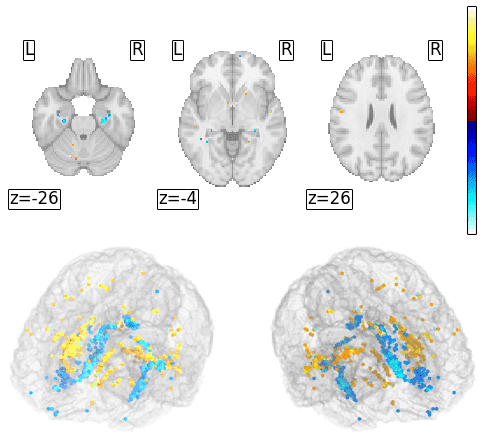
Slices of the Z-map (top), 3D view of the Z-map (bottom).
Discussion
Known Regions and Structures
While there are many different brain regions associated with different types of dementia, we chose to focus on these regions: hippocampus, entorhinal cortex, basal ganglia, caudate nucleus, putamen, Wernicke’s area, and Broca’s area. For the hippocampus, the memory and spatial navigation is affected which leads to memory loss and difficulty learning new things. Since the entorhinal cortex is the main connection to the hippocampus1, it has similar effects and leads to the same symptoms. For the basal ganglia, movement and coordination is affected which leads to Parkinson’s symptoms, rigidity, and slow movements. Caudate nucleus and putamen are also part of the basal ganglia. The caudate nucleus focuses on planning movement, whereas the putamen is involved in motor control and coordination. When it comes to dementia, the caudate nucleus is one of the first areas that are affected. For the caudate nucleus, the cognitive functions involving learning, memory, and motor functions are affected which leads to jerky movements, cognitive decline, and depression2. For the putamen, motor functions and cognitive functions such as building habits get affected, which leads to loss of motor control, having trouble with executing tasks, and lack of motivation name3. Since aphasia is a common symptom of dementia, Wernicke’s Area and Broca’s Area are also affected. Aphasia is when an individual has trouble with speech, communication, and language comprehension4. For Wernicke’s Area, the language comprehension is affected by dementia which leads to fluent speech, but using made up words. For Broca’s Area, speech production is affected which leads to understanding what others are saying, but having difficulty forming grammatically correct sentences.
1 “Entorhinal Cortex – an Overview | ScienceDirect Topics.” Sciencedirect.com, 2016, www.sciencedirect.com/topics/neuroscience/entorhinal-cortex.
2 Barrett, Emma, et al. “Reduced GLP-1R Availability in the Caudate Nucleus with Alzheimer’s Disease.” Frontiers in Aging Neuroscience, vol. 16, 10 June 2024, https://doi.org/10.3389/fnagi.2024.1350239. Accessed 6 Dec. 2024.
3 Neuroscientifically Challenged. “Know Your Brain: Putamen.” Neuroscientifically Challenged, neuroscientificallychallenged.com/posts/know-your-brain-putamen.
4 S. Srakocic. “What’s the Difference between Aphasia and Dementia?” Healthline, Healthline Media, 18 Aug. 2023, www.healthline.com/health/dementia/aphasia-vs-dementia.
Our Findings in Known Regions
The hippocampus had a positive effect in the gray matter and a negative effect in the white matter. In both cases, the effect was stronger on the right hippocampus.
| Matter | Left Hippocampus | Right Hippocampus |
|---|---|---|
| White | -0.818081 | -0.483652 |
| Gray | 1.105793 | 0.655024 |
The entorhinal cortex is not directly listed in atlas regions but, we do know it’s within the medial temporal lobe and it’s connected to the hippocampus. Because of this, we’ll look at the parahippocampal gyrus and the temporal pole due to the cortex’s proximity to both structures. The gray matter of the parahippocampal gyrus had a positive effect with minimal difference between hemispheres. In contrast, the white matter had a negative effect with a stronger effect in the right parahippocampal gyrus.
| Matter | Left Parahippocampal Gyrus | Right Parahippocampal Gyrus |
|---|---|---|
| White | -1.037742 | -0.821965 |
There was a CDR effect on both the middle and superior temporal pole in gray and white matter. The effect on the gray matter of the middle temporal pole was positive while the effect on the region’s white matter was negative. They also differ in lateralization as the white matter had a stronger CDR effect in the right middle temporal pole while the gray matter had a stronger CDR effect on the left.
| Matter | Left Middle Temporal Pole | Right Middle Temporal Pole |
|---|---|---|
| Gray | 2.694531 | 2.027771 |
| White | -0.376067 | -0.469509 |
In the superior temporal lobe we saw the same difference in direction and lateralization: white matter was negative and stronger on the right, gray matter was positive and stronger on the left.
| Matter | Left Superior Temporal Pole | Right Superior Temporal Pole |
|---|---|---|
| Gray | 0.968997 | 0.861277 |
| White | -0.052475 | -0.099275 |
Upon reviewing the atlas region masks and comparing it to images of the entorhinal cortex, we decided to also look at the temporal middle gyrus. Here CDR’s effect was positive in the gray matter and negative in the white matter. In this case, the effects were stronger on the left side regardless of matter.
| Matter | Left Middle Temporal Gyrus | Right Middle Temporal Gyrus |
|---|---|---|
| Gray | 0.140352 | 0.039561 |
| White | -0.134828 | -0.091745 |
The basal ganglia is broken into three sub-structures: the caudate, putamen and pallidum. CDR shows a significant positive effect bilaterally in the caudate for both white and gray matter although the left caudate had a slightly stronger effect. The putamen by contrast had a negative effect that was stronger on the right. Effects in the pallidum were minimal by comparison:
| Basal Ganglia | Pallidum | Putamen | Caudate |
|---|---|---|---|
| Bilateral Average | 0.2973855 | -1.4426565 | 1.3350955 |
To identify the atlas regions that might correspond to Broca’s Area, we had to manually review all the left maps of the frontal lobe and compare them visually with the known location of Broca’s Area. Language is lateralized and all our participants are right-handed so we can limit it to the left hemisphere. Broca’s area is located lateral/inferior to the midline, proximal to the temporal lobe, and anterior to primary motor cortex within the frontal lobe. This means atlas regions of particular interest to review are those in inferior frontal gyrus1. To ensure we are looking at all regions potentially associated with Broca’s we reviewed the effects for the following:
- Rolandic Operculum
- Frontal Inferior Orbital Gyrus
- Frontal Inferior Operculum
- Frontal Inferior Triangularis
There was a positive bilateral effect in the rolandic operculum from CDR. Gray matter had a stronger effect. There was minimal lateralization of effect.
| Rolandic Operculum | Gray | White |
|---|---|---|
| Bilateral Average | 0.643875 | 0.352743 |
In the white matter of the left frontal inferior orbital gyrus, there was a small negative effect. By contrast, the right frontal inferior orbital gyrus had a positive effect of a similar magnitude and the gray matter effect was positive bilaterally.
| Matter | Left Frontal Inferior Orbital Gyrus | Right Frontal Inferior Orbital Gyrus |
|---|---|---|
| White | -0.057595 | 0.044225 |
The frontal inferior operculum had positive effects in both the gray and white matter with the largest being in the gray matter of the left frontal inferior operculum.
| Matter | Left Frontal Inferior Operculum | Right Frontal Inferior Operculum |
|---|---|---|
| Gray | 0.515494 | 0.336771 |
The frontal inferior triangularis had positive effects in both the gray and white matter. The most significant was in the gray matter of the left frontal inferior triangularis.
| Matter | Left Frontal Inferior Triangularis | Right Frontal Inferior Triangularis |
|---|---|---|
| Gray | 0.515494 | 0.336771 |
The stronger effects on the structures in the left hemisphere align with the fact that language is a lateralized process. All of our participants are right-handed so their language process will be on the left side. The most interesting finding here was the negative effect in the white matter of the left frontal inferior orbital gyrus while white left was positive and the gray matter was positive bilaterally.
Wernicke’s Area is another region not directly included in the atlas structures so once more we had to manually review the maps and compare it with diagrams of Brodman’s areas. From this, it appears the superior temporal gyrus has the most overlap and is known to be involved in speech, language, and auditory memory. CDR in the superior temporal gyrus had a positive effect in both gray and white matter. The most significant lateralization was in the right gray matter of superior temporal gyrus.
| Matter | Left Superior Temporal Gyrus | Right Superior Temporal Gyrus |
|---|---|---|
| Gray | 0.216044 | 0.039519 |
From this comparison with known brain regions, we can gain an understanding of what we might find in the brain regions with a significant difference between the effects age and CDR.
1 “Broca Area – an Overview | ScienceDirect Topics.” Sciencedirect.com, 2014, www.sciencedirect.com/topics/medicine-and-dentistry/broca-area.
2 “Superior Temporal Gyrus – an Overview | ScienceDirect Topics.” Sciencedirect.com, 2009, www.sciencedirect.com/topics/neuroscience/superior-temporal-gyrus.
Our Most Significant Regions Affected by CDR
The purpose of our project was to identify voxel-level differences between normal aging and dementia from MRI’s. Through our analysis we were able to find regions that had opposite effects from age compared to CDR. When reviewing the regions with the greatest difference (using absolute value, CDR effect – age effect), the eleven regions with the strongest differences were in the gray matter. Of those regions, seven were substructures of the cerebellum, three were in the frontal lobe and the last was the left caudate which is part of the basal ganglia. In all of these regions, the age effect was negative while the CDR effect was positive. Only two regions in the top twenty did not have completely opposite effect: the left cerebellum crus 1 and the right cerebellum lobule 3.
Top 20 Gray Matter Findings by Structure
| Cerebellum | Frontal Lobe | Limbic System | Temporal Lobe | Notes |
|---|---|---|---|---|
| Vermis 6 | Frontal Medial Orbital (L&R) | Caudate (L) | Superior Temporal Pole (R) | |
| Cerebellum 6 (L&R) | Frontal Middle Orbital (L&R) | Right frontal middle orbital had a significantly greater difference than the left. | ||
| Vermis 8 | Frontal Superior Orb (R) | |||
| Cerebellum 4 & 5 (L&R) | Rectus Gyrus (R) | |||
| Vermis 7 | ||||
| Vermis 4 & 5 | ||||
| Cerebellum Crus 1 (L) | ||||
| Cerebellum 3 (R) |
Within the top twenty, only two regions were in the white matter: the left and right putamen. The putamen, like the caudate, is also part of the basal ganglia which is part of the limbic system. Just like before, age showed a negative effect while CDR had a positive effect.
The primary structure with the most effect is the cerebellum which has been is associated with neurogenerative diseases. Lobules 6 lesions are associated impaired cognitive performance, attention and memory. Lobule 4 and Crus 1 have been identified in cognitive impairment connective research. The cerebellar vermis is the most interesting area and the hardest to find information on its connection to dementia. The vermis seems to be more affected during the early stages of dementia.
Our hypothesis what that dementia will have a specific pattern of degeneration in the temporal, frontal and parietal lobes while age would have a more generalized degradation. When calculating out Pearson’s R Coefficient for normalized whole brain volume (nwbv) compared to age and cdr, we proved that while both have a negative relationship, age is much stronger. Age and nwbv had a nearly linear negative relationship (-0.8726…). This supports our idea that there is more generalized brain atrophy in response to age compared to demented status. The main part of the project was to identify the specific regions and patterns of degeneration. We specified three lobes in our hypothesis and of our top twenty regions 6 were in the frontal lobe and one was in the temporal lobe. Our hypothesis completely neglected to mention specific structures like the limbic system and neglected regions outside the forebrain like the cerebellum where the majority of our findings were. Our hypothesis also specified degeneration of these regions which means we excluded the effects of inflammation and plaque build up on density measures.
Limitations & Solutions
For our analysis, we found some limitations along the way and here are the solutions for how to overcome these limitations.
As previously mentioned, we used a brain atlas to help better visualize the results. The issue with using atlas is that it to mask it, we used the mean z-scores for the region. Using the mean z-scores for regions can be misleading for many reasons including: unable to differentiate what regions have more activity or less activity, no information on variability, outliers can skew the results, and important sub-regions might get overlooked. To account for all of these negative aspects of using the mean z-scores, we could manually review the regions using Magic Voxel.
Another limitation is the vagueness of some of the information. From our results, we found that there is negative density. Density is very complex, there are many factors that can affect density. For example, density in gray matter doesn’t necessarily mean neuron soma density. By using such a broad term, we can not pinpoint exactly what negative density means. The solution for this is to have a better understanding of how MRI’s work.
The last limitation is that there is no comorbidity information on participants and missing data. Not having information about participants’ comorbidities can influence the results since one can not account for the effects that it can have on the research. Additionally, having missing data can skew results if not properly interpreted. Missing data also forces one to exclude certain participants or impute the mean for it instead. As stated above, imputing the mean may not necessarily be an accurate representation of the sample, but is the only way to continue with the results. For this limitation, it would be best to have more comprehensive participant data to make sure that the results are representative of the population and not other confounds. Having more information also means we don’t have to impute the mean which ensures that all the data is accurate.
Team Contributions
Adam Kehl:
- Meeting showcases
- Abstract
- Research Question
- Hypothesis
- Dataset Walkthrough Notebook
- To ensure all members could understand working with our data and specifically MRI data, Adam made an entire notebook within the first week of the project to review
- Brain Atlasing Notebook
- MagicaVoxel Script
- Demographic Data Overview
- Worked with Sam on cleaning & tidying
- MRI Data Overview
- MRI EDA
- Final Analysis
- Video/Slides
Samantha Shade:
- Led weekly team meetings
- Demographic Data Overview & Prep
- Created visualizations
- Gray vs white matter
- Worked with Adam on cleaning & tidying
- Demographic Data EDA
- Visualizations and explanations
- Created several OLS models to compare variables effects
- Final Analysis
- Brain region grouping
- Regions where CDR > Age
- 3D images display
- generated the images w/ Adam
- Conclusion
- Brain regions in our findings
- Comparison table between findings and literature
- Answering the Research Question
- Video/Slides
- General edits & formatting